As presented in the last couple of posts, my first linear model predicts BMI using BloodPressure. The results are shown below:
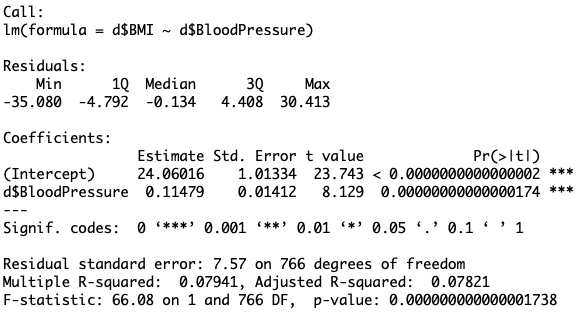
The R-squared for this model is .079, just under 8%. So variations in blood pressure explain only 8% of the variations in BMI in our dataset. This means we have much of this problem left to solve.
While 8% is not “high”, it’s substantial enough to say that blood pressure is a reasonably important predictor. But we could improve this model by incorporating additional predictors, perhaps other indicators of overall wellness.
In the next post, we’ll figure out how to add additional predictors and hopefully explain more of the variation in BMI.
